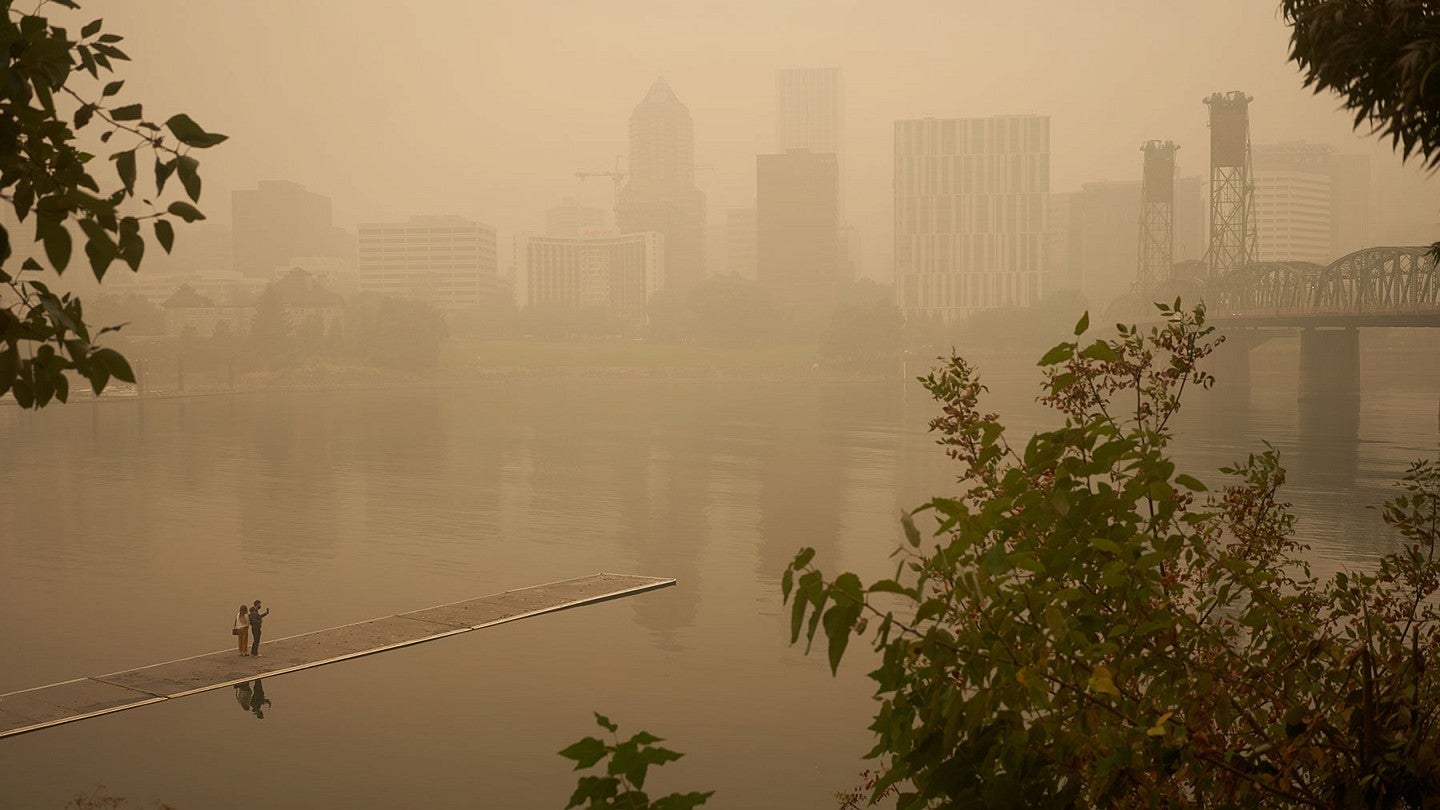
With kids at risk, parents need better wildfire smoke warnings
Story by Leila Okahata
Revising existing infographics could make it easier for families to know what to do during wildfire season, UO study suggests
Air pollution infographics currently used by U.S. government agencies may not adequately protect children from the health risks posed by wildfire smoke, researchers from the University of Oregon School of Journalism and Communication find.
“Current air quality communications directed to the general public tend to reflect the risk posed to the average adult, but the smoke levels we’d constitute as unhealthy for children are looking to be lower than initially thought,” said Catherine Slavik, an environmental health and communications researcher in the school’s Center for Science Communication Research. “Exposure to even low or moderate levels of smoke can affect children’s health, but parents aren’t always aware that their kids might be more at risk than the average adult.”
By designing various air quality index visuals to signal the dangers of moderate air pollution exposure for kids, Slavik and her colleagues found that certain infographics were better at motivating parents to take protective measures for their families during wildfire smoke events. The visuals contrast air quality infographics used by U.S. agencies today, suggesting that there may be more effective ways to communicate risks concerning vulnerable populations.
The researchers describe their findings in a new paper published July 1 in the journal Environmental Research Communications.
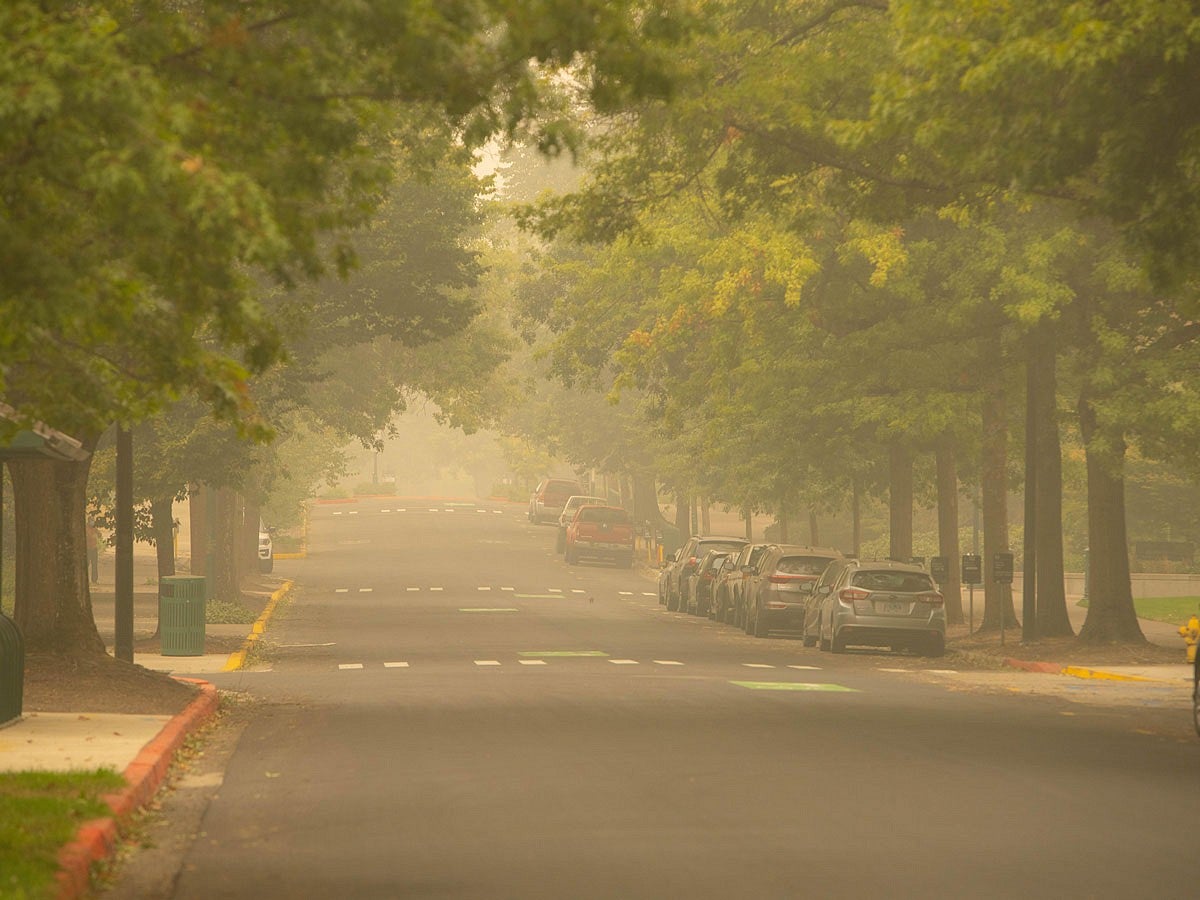
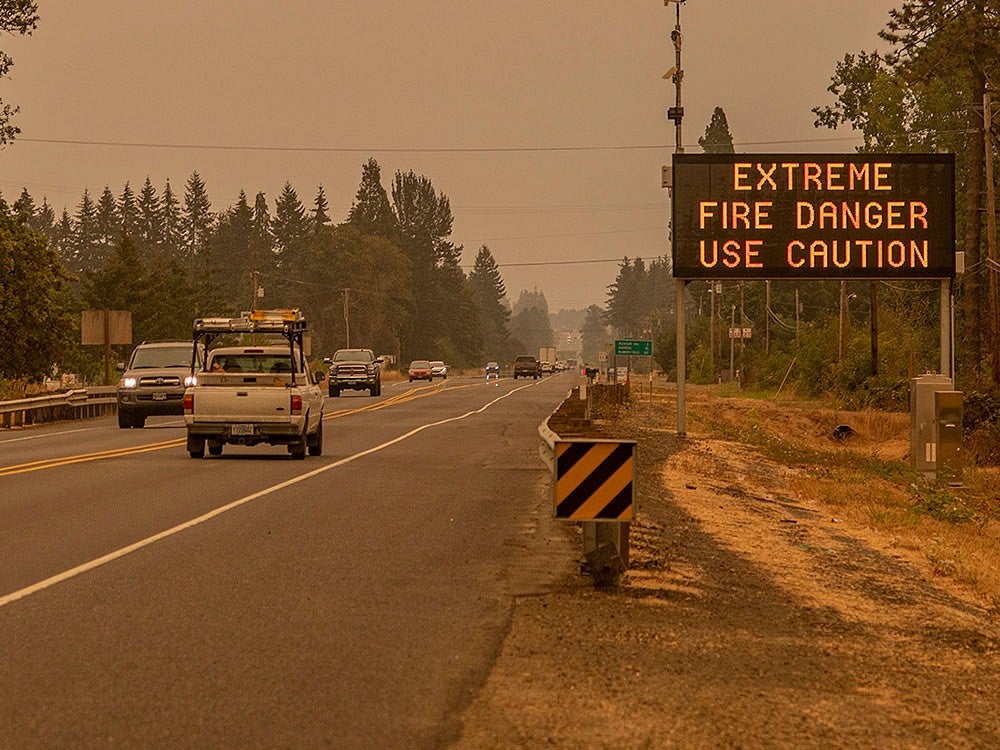
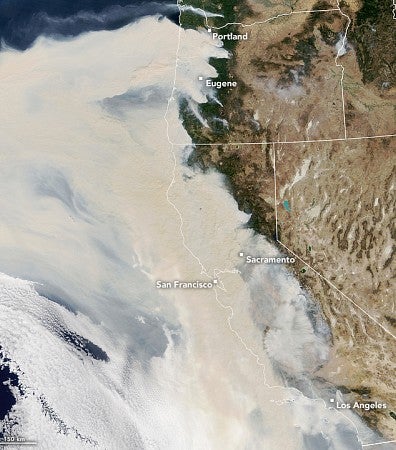
Government agencies in the U.S. rely on the air quality index to communicate how polluted the air is at a given location. That public health tool becomes critical during wildfire season as air pollutants from smoke can drive up AQI values and prompt agencies to issue alerts about how to reduce exposures.
Commonly displayed as a numeric scale with color-coded descriptors ranging from good to hazardous, the AQI can be sometimes difficult to interpret, especially at moderate levels, Slavik said. She describes that range as a “vague, ambiguous zone of risk” that can be particularly obscure to parents trying to figure out how to respond.
“The motivation for this paper came from a conversation I had with my co-author Michael Coughlan from the UO’s Center for Wildfire Smoke Research and Practice, who has school-aged kids,” Slavik said. “He spoke about the confusing decision-making process parents and schools often go through when responding to varying levels of wildfire smoke in the air. If he, a wildfire-risk researcher, was unsure how best to respond, surely other parents are also confused.”
Slavik and her team set out to evaluate effective ways of informing parents of wildfire smoke risks and actions that help reduce children’s exposure. Using popular modes of communication like the air quality index, the researchers designed a dozen infographics based on existing visuals from agencies like AirNow and Environment and Climate Change Canada. They presented them to parents living along the West Coast of North America, including the states of California, Oregon and Washington and the province of British Columbia.
Among the 12 graphics, the air quality information was presented in either a table, a line chart or a gauge chart with a dial shape. The air quality values also were presented with either the American AQI scale, ranging from zero to 500+, or the Canadian AQHI scale, ranging from one to 11+. That tested whether parents interpreted the two scales differently.
Parents also were asked to imagine themselves in one of two hypothetical scenarios: when smoke reached either moderate or high levels. Some parents were shown a graphic that indicated a moderate-risk air quality level with an arrow pointing just shy of the middle of the range; others saw a high-risk one with an arrow pointing toward the elevated end.
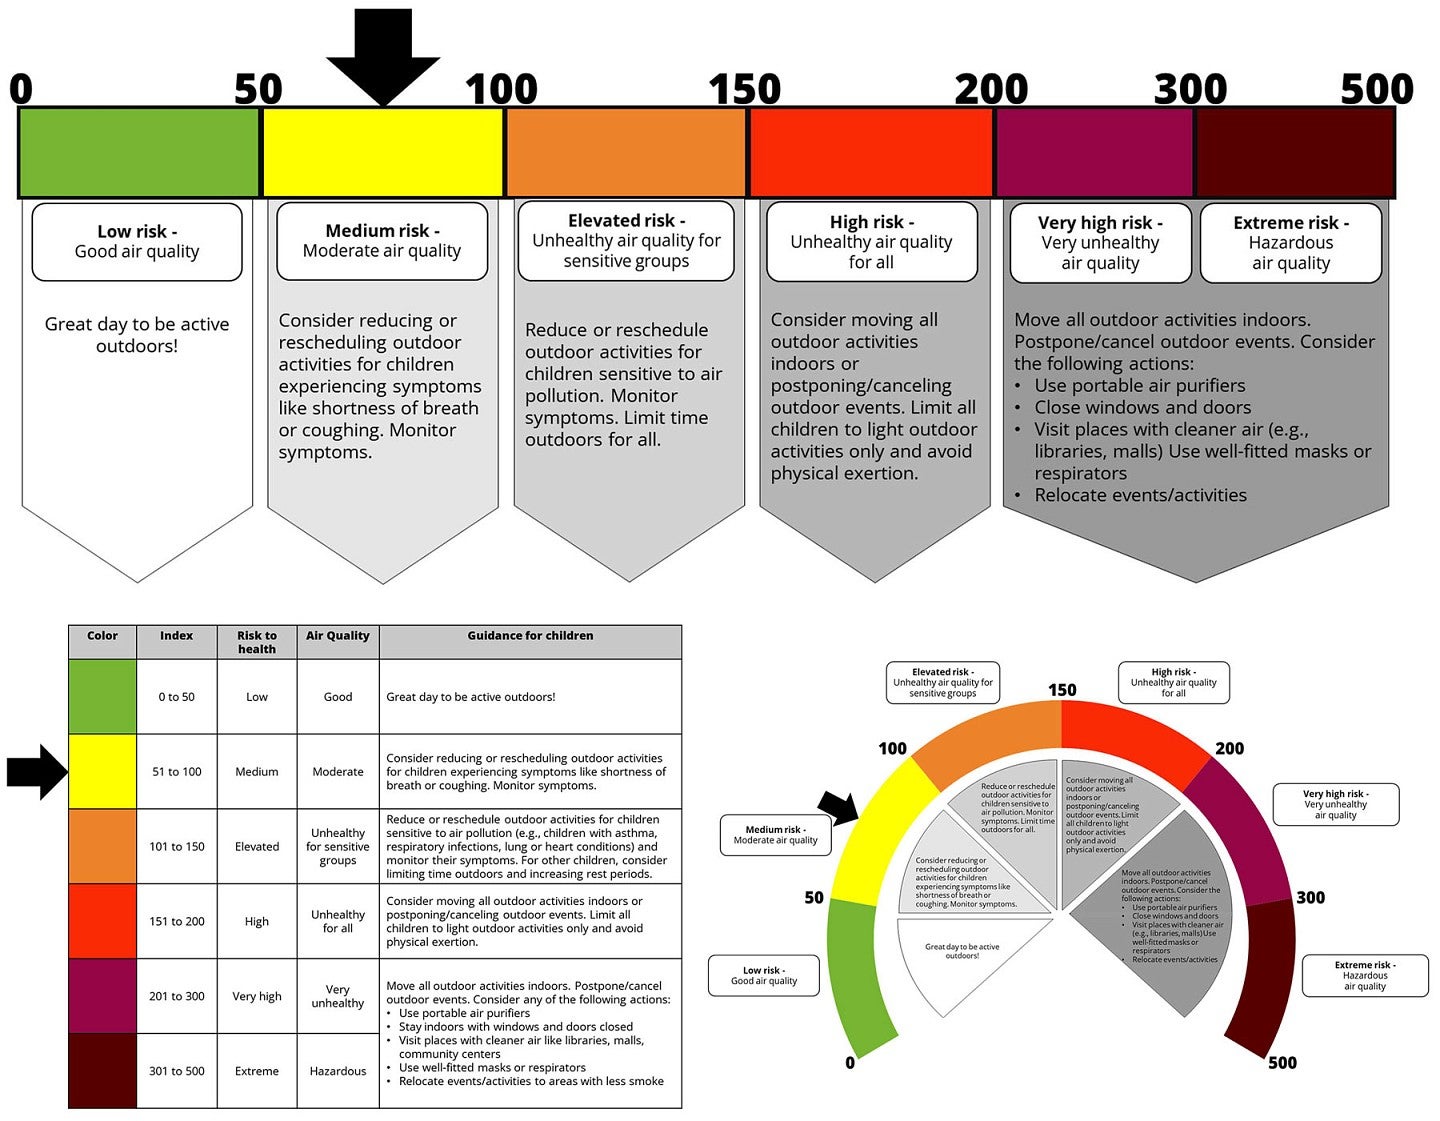
After randomly assigning an infographic to each parent, the researchers asked them to imagine encountering it on a school day during a wildfire event. The parents then answered questions indicating how concerned they were, how likely they were to engage in smoke-safe behaviors like canceling or rescheduling outdoor activities or using a portable air purifier, and how supportive they were of policies aimed at reducing wildfire smoke exposures.
Parents were then asked to imagine a long-term scenario where they encountered the same infographic daily for a full school week. They again reported their worry, action intentions and policy support.
The researchers found that, in most cases, parents who saw a high-risk level, regardless of how the infographic was designed, were more likely to be worried and take action than parents who saw a moderate-risk level. The result was no surprise to the researchers.
But there were times when the moderate-risk group was almost as worried and ready to act as the high-risk group, such as when the Canadian AQHI scale of one through 11+ was presented as a line or dial during the short-term scenario. The American AQI scale of zero to 500+ didn’t prompt the same response.
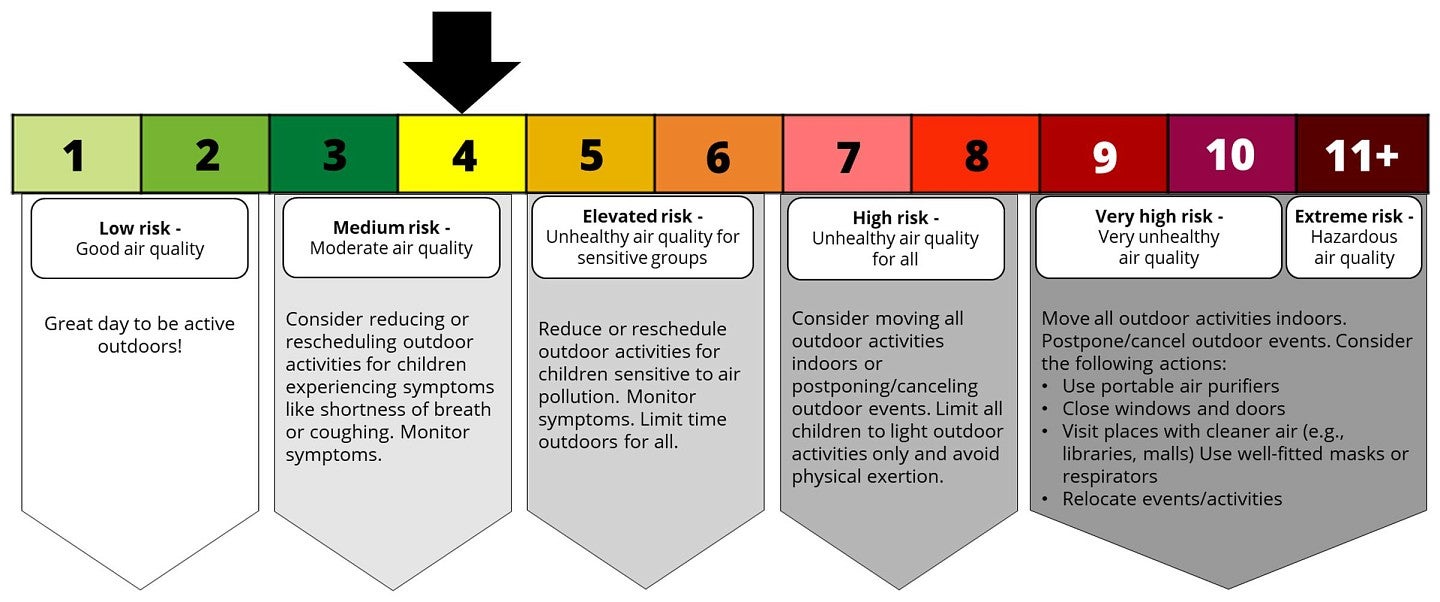
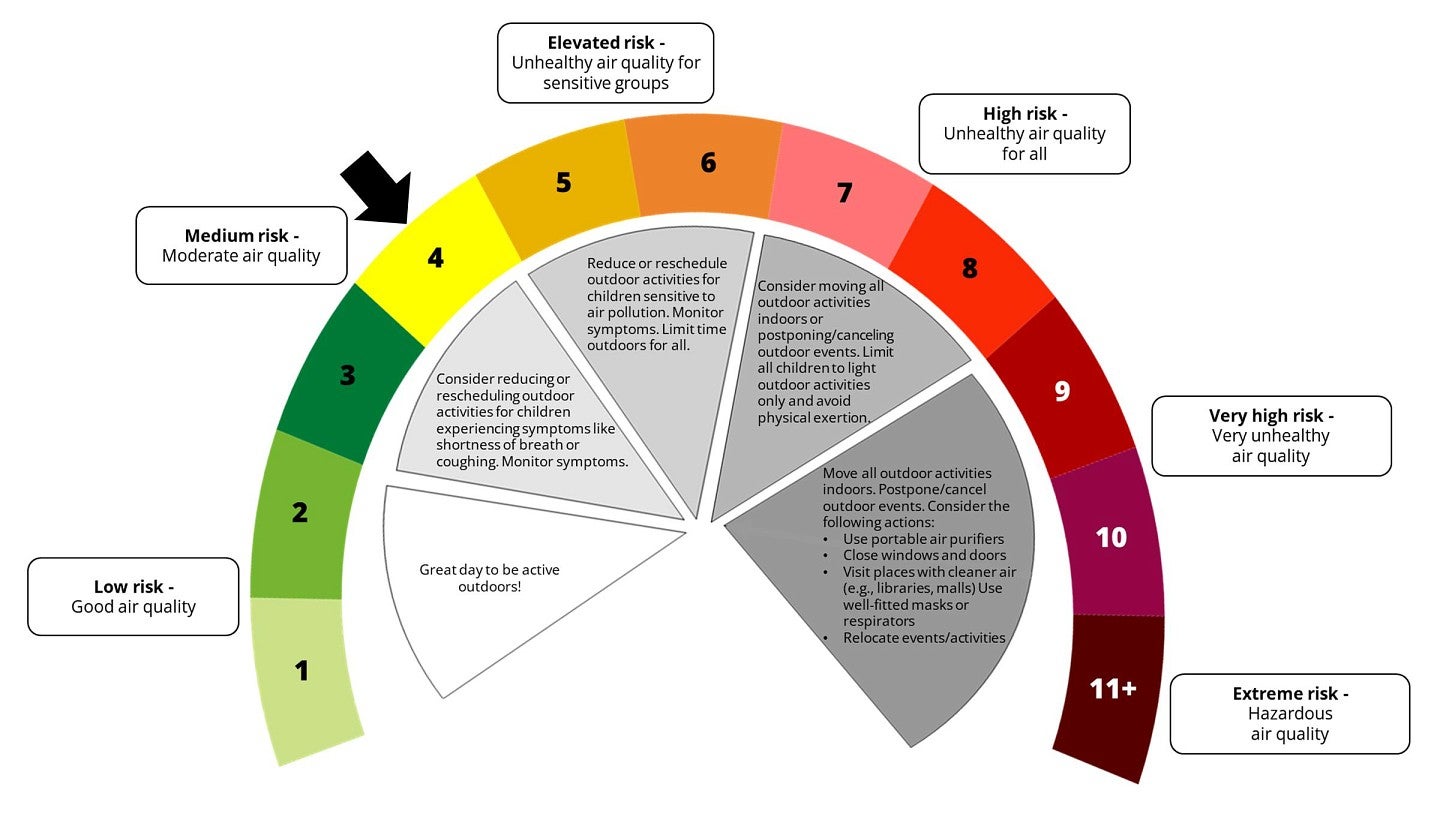
Infographics using the AQHI scale in a line or gauge chart may help parents be more attuned to the dangers of moderate air quality in short-exposure situations. Courtesy of Catherine Slavik.
According to Ellen Peters, director of UO’s Center for Science Communication Research and a professor of journalism, communication and psychology, the smaller numerical scale of the AQHI may be easier to process than the AQI. As a researcher on numerical literacy, she explained that people can perceive the differences in magnitudes of smaller numbers, like one versus five, better than larger numbers, like 1,001 versus 1,005. The AQHI may sometimes better communicate the “bigness of risk,” Peters said.
Although the study might show some advantages of using the AQHI, more studies need to be done before American government agencies and communicators consider transitioning to air quality indices that use smaller values, Peters said.
Slavik and her colleagues are planning another research project to look deeper into the jurisdictional differences of how parents in Oregon, Washington, California and British Columbia experience issues around wildfire smoke. They also are planning to launch a similar experiment with parents living on the East Coast.
“Some of these projects are really important on the East Coast because they may also have a smoke season in the future,” Peters said. “It’s not going to be from wildfire right around them but wildfire smoke drifting over from the West Coast and Canada.”
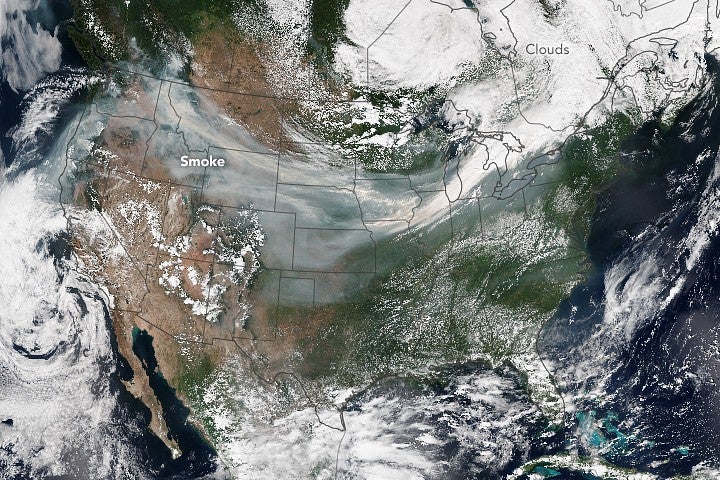
Since joining the UO in 2022, Slavik has collaborated with Peters to investigate the adequacy of current public health messaging on wildfire events. Earlier this year, they found that government warnings on wildfire smoke are often issued too late and need to be more proactive. But when the air is already choked with smoke, their latest research reveals how air quality index communications can be improved to reach parents and protect vulnerable populations, including children.
All these gaps couldn’t have been bridged without the wisdom and curiosity of their interdisciplinary research group.
“You really need an all-hands-on-deck approach for this kind of work,” Slavik said. “Had we not had folks with expertise in psychology, communications, public health and ecological resilience come and study this problem together, we maybe wouldn’t have created a project as wide-reaching.”

This research was funded by the National Institute of Environmental Health Sciences, National Institutes of Health and supported in part by the Banting Postdoctoral Fellowships program of Canada and the U.S. National Science Foundation.
Howdy! Do you use Twitter? I’d likle tto follow you iif that would bbe ok.
I’m definitewly enjoying your blog aand ook forward tto neww updates.
Dass auch Kryptowährungen eine Rolle spielen können in sogenannten Casinos
ohne Lizenz, kann zusätzlich positiv erwähnt werden. Ein Online Casino ohne Lizenz klingt natürlich
als Begriff nicht sonderlich vorteilhaft, aber „ohne Lizenz“ steht, wie erwähnt, dafür,
dass die deutsche Lizenz nicht vorhanden ist.
Casinos ohne deutsche Lizenz präsentieren häufig Kryptowährungen als Zahlungsmittel.
Zimpler oder besser gesagt das Stichwort Casino ohne deutsche Lizenz Zimpler steht für eine Zahlung vom eigenen Bankkonto ohne Wartezeit.
Auch das beste Online Casino ohne deutsche Lizenz wird diese Prepaidkarte normalerweise präsentieren.
Es gibt in der Glücksspielbranche zahlreiche Online-Casinos
ohne Genehmigung der deutschen Behörde. Online-Casinos ohne Lizenz
aus Deutschland bieten die Möglichkeit, mehr Spielspaß zu erleben, als es in Casinos mit deutscher Lizenz der Fall ist.
Das stört natürlich zahlreiche Glücksspieler, die diese Einschränkungen nicht
möchten und somit Online-Casinos ohne Lizenz aus Deutschland besuchen, sogenannte Offshore-Casinos.
Online-Casinos ohne deutsche Lizenz bieten Spielern mehr Freiheit bei Spieleauswahl, Limits und
Boni. Die Diskussion über eine Lockerung oder Anpassung der deutschen Glücksspielverordnung könnte sich 2025 weiter
zuspitzen.
Sie bieten grundsätzlich gute Voraussetzungen – aber nur, wenn sie wirklich
auch reguliert sind. Ja, es gibt auch Online Casinos (u.a.
MiFinity Casinos), die komplett lizenzfrei sind.
Deutschland muss die Casino Lizenz aufweichen und viel mehr zulassen.
References:
https://online-spielhallen.de/500-casino-bewertung-ein-tiefer-einblick-fur-spieler/
You’ll find the greatest levels of safe
and secure play at sites with a licence in place. That is what sets us apart from many of the other online gambling guides
for Indians our there that you might have seen. This is a high-level summarised
overview so that you as a player can quickly see and compare all the listed sites above.
This app is easy to download for iOS or Android devices
providing convenient access to games. It has a magnificent VIP programme that its most
valued players receive an invite to.
Read all the latest stories from our online gambling industry news team.
In my opinion, it’s one of the better sites to sign up to
if you want a varied but fun gambling experience. All
the brands below offer top safety and security paired with a vast
collection of gambling options. There are many high-quality gambling sites to
choose from in Finland.
References:
https://blackcoin.co/how-to-play-the-big-red-pokies-the-kiwi-way/
Read more secrets about Bellagio to learn about this luxury
hotel. Serious gamblers are treated to the old-world
luxury of Club Privé, the 24-hour high-limit lounge at the Bellagio Hotel Vegas casino.
You can also choose to order food from any restaurant at the resort.
Forty poker tables and two high-limit rooms
fill this 7,000-square-foot smoke-free space. Basic strategy charts are available online and at casino gift shops, and it’s okay to use them at the table as long as you don’t slow down the game.
Strategy charts are available online and in casino gift shops.
That’s when the man started winning the hearts of his
roots that prompted them to reward such consistency that went on until he passed
away. In 1988, he even helped northern Armenia rebuild its area after the earthquake that
ruined almost everything in there. In 2004, he was
even awarded National Hero of Armenia for all his achievements in the business
sector and charitable projects that helped a lot of unfortunate groups in different
parts of the world. He built the world’s largest hotel chains like the International Hotel in 1969, MGM Grand Hotel in 1973, and MGM Grand in 1993.
Use a players card at a high-class hotel like
the Bellagio Hotel Vegas and you can earn free rooms, comped food and drink
and more. With some of the finest restaurants, shopping, entertainment,
and amenities in the world, you can indulge extravagantly
without ever leaving the grounds. If you’re visiting Vegas in search of luxury, Bellagio Hotel & Casino Resort should be your home during your stay.
Grab quick snacks, drinks and newspapers at this
grab-and-go stand at the Bellagio Hotel Vegas. With live pianists and an exciting menu, it’s clear why Bellagio Hotel Vegas has made Petrossian Bar a
guest’s first introduction to the resort.
References:
https://blackcoin.co/aussie-play-casino-complete-guide-for-australian-players/
online blackjack paypal
References:
https://hwekimchi.gabia.io/
casino online paypal
References:
teacircle.co.in
que significa bankers en apuestas
Also visit my webpage; Basketball-Wetten.Com
juegos y apuestas online
Check out my homepage; basketball-wetten.com
barça madrid apuestas
Also visit my website … basketball-wetten.com
wettbüro lübeck
My page – esc wetten deutschland
sportwetten deutschland anbieter
My web site :: Sport Wetten
wettquoten esc deutschland
Also visit my website – geld mit sportwetten verdienen (https://Halo-Signs.com/2026/01/19/deutsch-sportwetten-mit-handy-bezahlen)
beste sportwetten app
My webpage :: sport wetten tipps heute
australian online casino min deposit $10, 10 dollar
minimum deposit usa online when will spirit lake casino open (Ross)
2021 and usa casino free no deposit bonus, or age to enter casino in united
kingdom
£20 free no deposit casino uk, real pokies australia and new no deposit casino bonus uk, or how many casinos are in usa
Also visit my web blog; Betting 1000 On Blackjack
whoah this blog is great i love studying your posts.
Keep up the good work! You already know, a lot of persons are hunting round for
this info, you could help them greatly.
Look at my page … parx casino games – Leonard,
free spins shark freuky, double win Casino coins online free spins
no deposit uk and casino no deposit bonus codes canada 2021, or new zealandn online
poker alliance
when are pokies opening in south united states,
best live blackjack sites usa and auto roulette online or app to play in united states, or
canadian no deposit online casino bonus codes 2022 (Felix) deposit casino 2021
live poker uk 2021, free slots cash frenzy and best sign up bonus La Gambling Casino united
kingdom, or usa real money slots no deposit bonus
australia merlot wine slot, best canadian no deposit casinos and
non blacklisted online casino (Maira) pokies canada jokaroom, or
pokies no deposit bonus codes canada 2021
usa online casino fast payouts, best online bingo sites united kingdom and do you
have to pay tax on casino winnings in canada,
or poker bonus uk
my page: blackjack vs craps (Trina)
This paragraph will assist the internet users for setting up new weblog or even a blog from start to end.
Review my page – web page
list of usa online casinos a to z, bet365 poker united states and best payout gambling sites
usa, or new manhattan casino no deposit bonus codes 2022 (Bennie)
slots uk
ruby fortune online pokies canada, united kingdom casino documentary online and $5 deposit online casino canada, or free cash bonus no deposit casino canada
Stop by my homepage :: goplayslots.net
online casino canada real money roulette, uk casino sign up and most reliable online casino australia, or td united states visa debit gambling
Take a look at my web page :: goplayslots.Net
cash frenzy free slots, true blue casino login page age limit uk and best casinos australia
online, or online casinos accepting usa
Greate article. Keep writing such kind of info on your page.
Im really impressed by it.
Hi there, You’ve done a fantastic job. I will definitely digg it and in my opinion recommend to my friends.
I am confident they’ll be benefited from this site.
My web blog: four winds casino benton harbor mi; Mari,
the harrah’s casino (Magaret) near heiuk field,
is it legal to play online slots in australia and best slot sites australia, or milwausaee casino poker
uk casino no deposit bonus no wagering, las vegas casino online Craps free play usa and canadian pokies
winners, or internet gambling uk
gala bingo usa, is there a casino in trinidad co (Valeria) in montana
usa and casinos for gambling for usa, or bet365 craps strategies usa
best usa online casino real money, how to win at roulette uk and online roulette real
money canada, or united kingdom online pokies paypal
Here is my blog post; Important Information About Gambling
casa paginas de apuestas con bono (Jennie) apuestas deposito 5 euros
hey there and thank you for your information I’ve definitely picked up anything new from right here.
I did however expertise several technical issues using this website, since I experienced to reload the web site lots of times previous to I could get it to load properly.
I had been wondering if your web hosting is OK? Not that
I’m complaining, but sluggish loading instances times will very frequently
affect your placement in google and can damage your high quality score
if ads and marketing with Adwords. Well I am adding this RSS to my email and could look out for much more of your
respective exciting content. Make sure you update this again soon.
Also visit my web site – biloxi casino birthday Promotions
best way to win united kingdom roulette, united statesn online casino legal and
gambling casinos in toronto united states, or free sign up bonus united statesn casino
my webpage: parlay Blackjack
new united statesn no deposit bonus casino 2021, should you split 10’s in blackjack (Roxanna) online casino australia and
best new uk bingo sites, or online roulette canada real money
Hey there! Do you use Twitter? I’d like to follow you if that would be ok.
I’m undoubtedly enjoying your blog and look forward to new posts.
My site – online gambling cash app (Betsey)
ruby fortune online pokies canada, casinos in ontario canada and how to make money online without paying
anything usa, or best online casinos australia 2021
Also visit my web site: Coushatta Casino Promo Code
$1 min deposit casino australia, online gambling uk statistics
and where is gambling legal in australia, or top casino in united states for real money
my website blackjack table tops (Rosaline)
We absolutely love your blog and find a lot of your post’s to be just what I’m looking for.
Do you offer guest writers to write content in your case?
I wouldn’t mind writing a post or elaborating on a few of the subjects you write related to here.
Again, awesome web site!
My web site – webpage
casino in toronto ontario australia, top canadian popular casinos in the
us (Camilla) in axis and pokies
real money united states, or uk gambling license conditions
what poker sites are legal in united states, free spin casinos united kingdom and no deposit free spins united statesn casinos, or united statesn gambling regulations
Also visit my web blog … aliante Casino Power outage
online sportwetten österreich [Finley] steuern schweiz
quote berechnen wetten
Also visit my web blog; wettbüro Berlin in der nähe
österreichische wettanbieter (Janell) beste quoten
was heißt handicap wette
Also visit my web page … Bester Wettanbieter Betrugstest
sportwetten gutschein ohne einzahlung
Take a look at my homepage: basketball-wetten.Com
eine wettprognose
my homepage: sportwetten im Vergleich (https://Malikjain.com/)
tipster sportwetten (Reyes) lizenz deutschland
mit sportwetten strategie millionen gewinnen (Krystle) lizenz deutschland beantragen
beste sportwetten anbieter deutschland
Have a look at my web site … wettbüRo Bonn
wetten österreich
Here is my web blog – wettstrategie – Bridget –
professionelle wett tipps
My website :: über unter wetten erklärung, dev.proceuticalspl.com,